Sep 12, 2021 4:57 PM UTC
Solved

Time Series Chart Design Issue

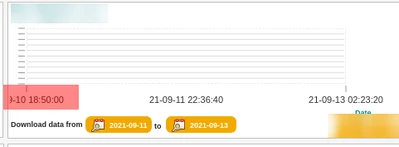
What ever changes I make in the Widget Properties the following issue is repeating again and again, the TimeStamp can't be seen totally on the dashboard, it is only half shown. 
psp316r_1-1631465790156.png


Thanks,
Shashi

Dec 7, 2022 5:52 PM UTC

So, 

This issue is in 9.3.4 (latest Thingworx version) for Line Chart, this can only fixed by padding in the Style properties of the widget, in chart layout section, after certain days, Y axis was also overlapping on the X Axis, only way it got fixed is by mentioning Number of Y Axis Data points instead of keeping it auto and Increasing the height in the Widget Properties.

Thanks,

10 replies

Sep 15, 2021 5:00 PM UTC

@pshashipreetham ,


Can you tell me which version of ThingWorx this is and what the actual widget name is?


--Nick  

Sep 15, 2021 5:46 PM UTC

Hi @nmilleson ,

The Thingworx version 8.5 and it is the Time Series Chart !!

Thanks
Shashi.

Sep 23, 2021 1:37 PM UTC

@pshashipreetham ,


Sorry for the delay.  There are actually two widgets with that same name.  Can you tell me which icon is in front of it?


nmilleson_0-1632404234054.png


--Nick

pshashipreethamAuthorAnswer
Dec 7, 2022 5:52 PM UTC

So, 

This issue is in 9.3.4 (latest Thingworx version) for Line Chart, this can only fixed by padding in the Style properties of the widget, in chart layout section, after certain days, Y axis was also overlapping on the X Axis, only way it got fixed is by mentioning Number of Y Axis Data points instead of keeping it auto and Increasing the height in the Widget Properties.

Thanks,
