Feb 29, 2024 6:09 AM UTC
Solved

Scatterplot creation

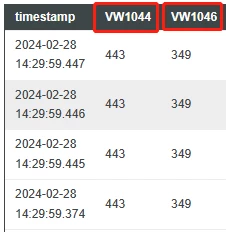
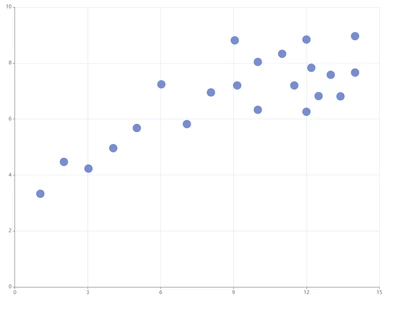
How should I be able to make a scatter plot of the two sets of data marked red in the graph, in order for me to easily see their relationship.For example, the scatterplot below.
企业微信截图_17091858467996.png

企业微信截图_17091867464390.png

RockoAnswer
Feb 29, 2024 7:14 AM UTC

You would use a Line Chart widget for this, it has a property "ChartType" which you can set to Scatterplot.

You assign the infotable returned by  a service call to the property Data, NumberOfSeries to 1, XAxisField to VW1044 and DataField1 to VW1046.

2 replies

RockoAnswer
Feb 29, 2024 7:14 AM UTC

You would use a Line Chart widget for this, it has a property "ChartType" which you can set to Scatterplot.

You assign the infotable returned by  a service call to the property Data, NumberOfSeries to 1, XAxisField to VW1044 and DataField1 to VW1046.

Snoopy_huAuthor
Feb 29, 2024 7:55 AM UTC

I tried to use it and he succeeded, thank you.
