
Apr 12, 2022 1:32 PM UTC
Solved

Line Chart - Empty Data after logged value

I have the attached Line Chart with 3 series and 3 sources. the data is only being logged on change but I would like to show the line (in this case Dancer PSI) to keep showing the line after the last logged value.

can this be done?
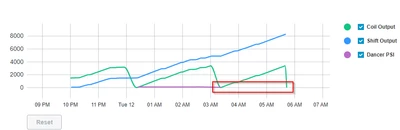
LP_10027711_0-1649770321685.png


PaiChungAnswer
Apr 14, 2022 1:00 PM UTC

I don't know if there are any easy ootb ways nowadays in TWX since things have changed in the various releases.

But in the past I would basically determine the last timestamp and insert a point into the table being returned to the mashup.

1 reply

PaiChungAnswer
Apr 14, 2022 1:00 PM UTC

I don't know if there are any easy ootb ways nowadays in TWX since things have changed in the various releases.

But in the past I would basically determine the last timestamp and insert a point into the table being returned to the mashup.