
Jun 18, 2024 8:55 AM UTC
Solved

i want to show the combination of Bar and line chart on same graph

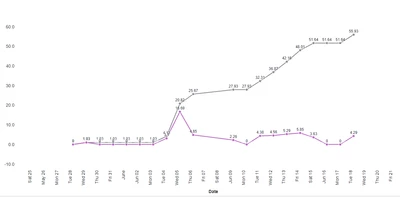
i have two rows as output , now i using line chart for the same to show the graph
Suraj_Patil_0-1718701236719.png

now here the requirement is,  want to show violet/scion color line graph as bar chart and gray color values as line chart how to achieve this combination is same widgets of chart

Jun 18, 2024 9:07 AM UTC

Hi @Suraj_Patil  For this requirement you can use a combo chart.

4 replies

Jun 18, 2024 9:06 AM UTC

Take a look:

Jun 18, 2024 9:07 AM UTC

Hi @Suraj_Patil  For this requirement you can use a combo chart.

Jun 18, 2024 1:29 PM UTC

combo chart is available in 9.5 and above version only right?

Jun 18, 2024 1:33 PM UTC

Hi @Suraj_Patil  From 9.4 and above.