Question
how can i interpolate x values and y values on the chart
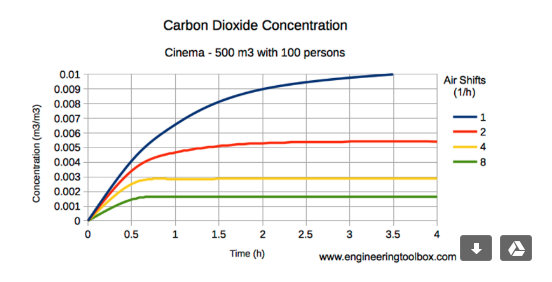
for example i have shown the figure
How can i plot such graphs
i have calculated all the parameters required for this
Please and kindly help

for example i have shown the figure
How can i plot such graphs
i have calculated all the parameters required for this
Please and kindly help
Enter your E-mail address. We'll send you an e-mail with instructions to reset your password.