
Dec 25, 2024 5:42 PM UTC
Solved

Bubble Scatter Plot

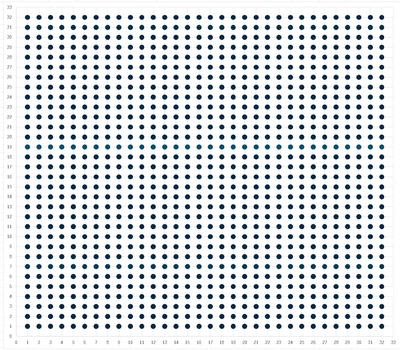
I want to make a bubble chart by by defining

i = 1 to 32

j = 1 to 32

so that 32 x 32 = 1024 points are generated
like as follows
(1,1), (1,2) , ... , (1,32)
(2,1), (2,2) , ... , (2,32)
.
.
.
(32,1), (32,2) , ... , (32,32)

the final output needed is
Arshad_Ali_0-1735148342320.png


anursinghAnswer
Jan 27, 2025 7:07 PM UTC

Hi @Arshad_Ali,

Thank you for your question. 

Your post appears well documented but has not yet received any response. I am replying to raise awareness. Hopefully, another community member will be able to help.

Also, feel free to add any additional information you think might be relevant. 


Regards,

Anurag 

2 replies

anursinghAnswer
Jan 27, 2025 7:07 PM UTC

Hi @Arshad_Ali,

Thank you for your question. 

Your post appears well documented but has not yet received any response. I am replying to raise awareness. Hopefully, another community member will be able to help.

Also, feel free to add any additional information you think might be relevant. 


Regards,

Anurag 

Oct 22, 2025 4:31 AM UTC

@Arshad_Ali 

You don't say which software you want to use!??


In case you have Prime in mind, it would be best to post in the Mathcad section of this forum -> Mathcad - PTC Community

Here are two ways to achieve what you are asking for using Prime:

Werner_E_1-1761108099191.png


Werner_E_2-1761108131677.png


Prime 11 sheet attached