
Apr 10, 2017 5:20 PM UTC
Question

Questions about ThingWorx Analytics Builder

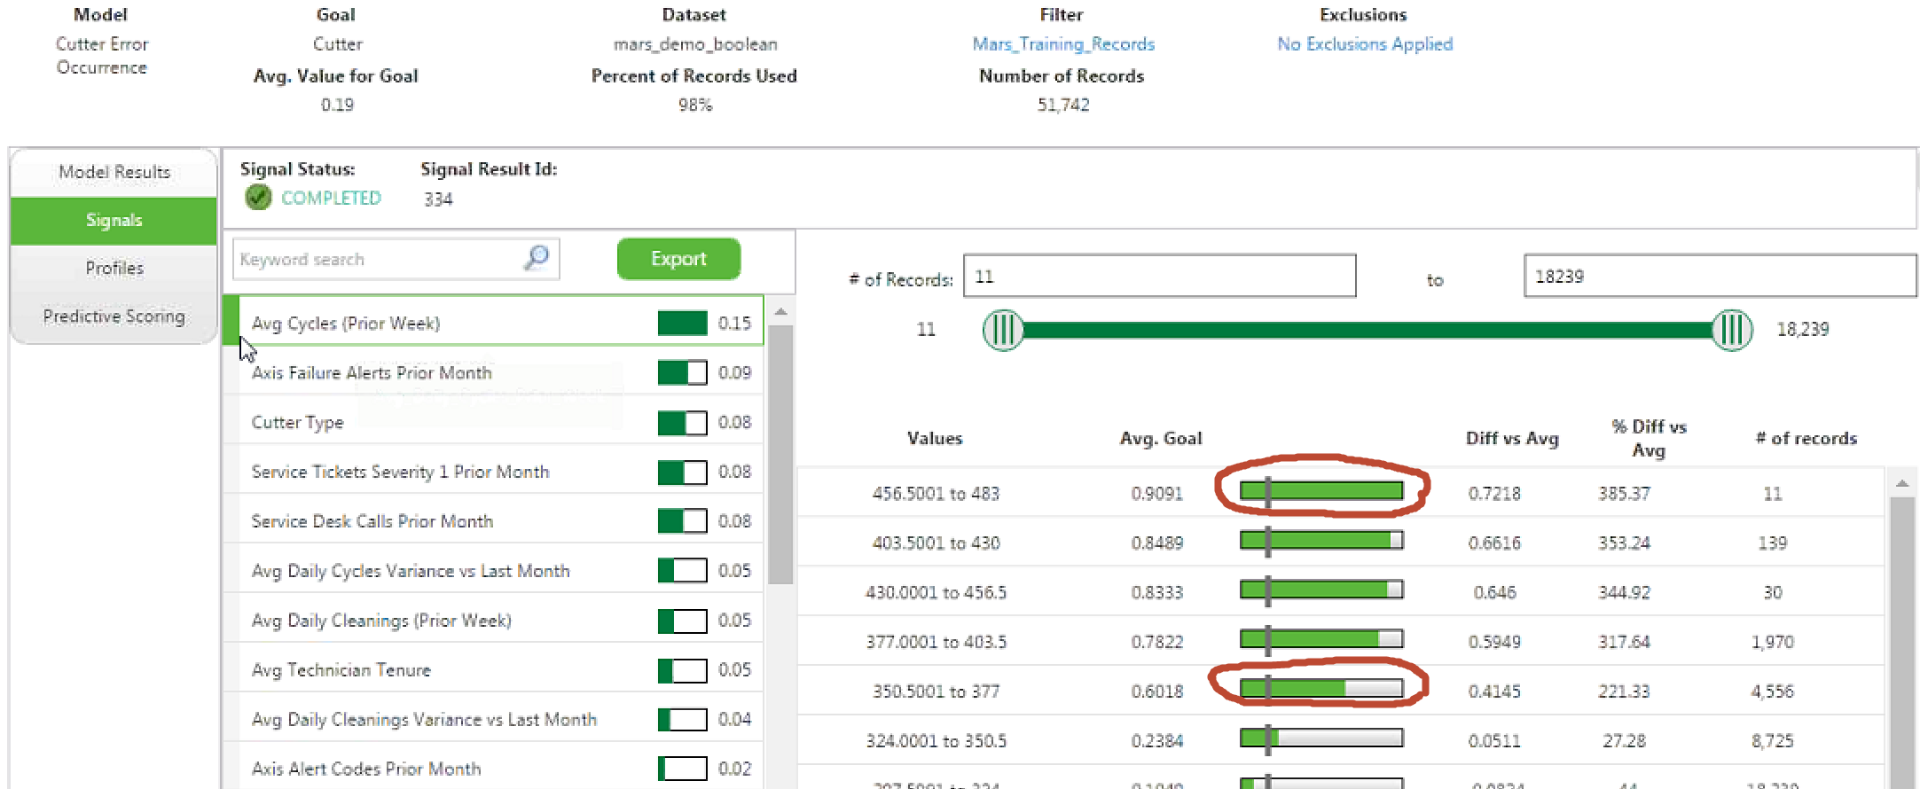
I have questions about ThingWorx Analytics Builder. I don't know what the red circles mean in Signal View below. Can anyone explain what it means?

I don't particularly understand the meaning of the gray vertical bar in the green horizontal bar.
Thank you.

1 reply

Apr 11, 2017 1:52 PM UTC

Yong June Kim,

There is a video series that covers these concepts and are available to you in the Partner Community.

Please review this video: Video Link : 1691; it covers Signals and how to interpret them at the 2:25 mark.

The horizontal gray bar indicates the average value. (Which in this case is 0.19).

The green paint that passes the horizontal gray bar indicates how high the chance of failure is.

E.g. Cycles prior week from values 456.5001 to 483 have a 90% chance of error.

For Cycles that have values from 350.5001 to 377 have a 60% chance of failure.

If the green paint does not pass the horizontal gray bar the chance for failure minimizes.

If you have any additional questions, please let me know.

Regards,

Neel