
Archived
Multiple graph display in simulate results
Hello,
In Simulate, can we display multiple graph lines into a same result graphic?
Example: I have a model with 10 measurement points. In dynamic study, each measurement point calculates an RMS constraint at a point of the model as a function of a frequency (over a 0-20Hz range for example). I get the following graphs. It is quickly unreadable ... If we could put the 4 on the same chart it would be better (and again, there are 4, imagine with 10 ...)
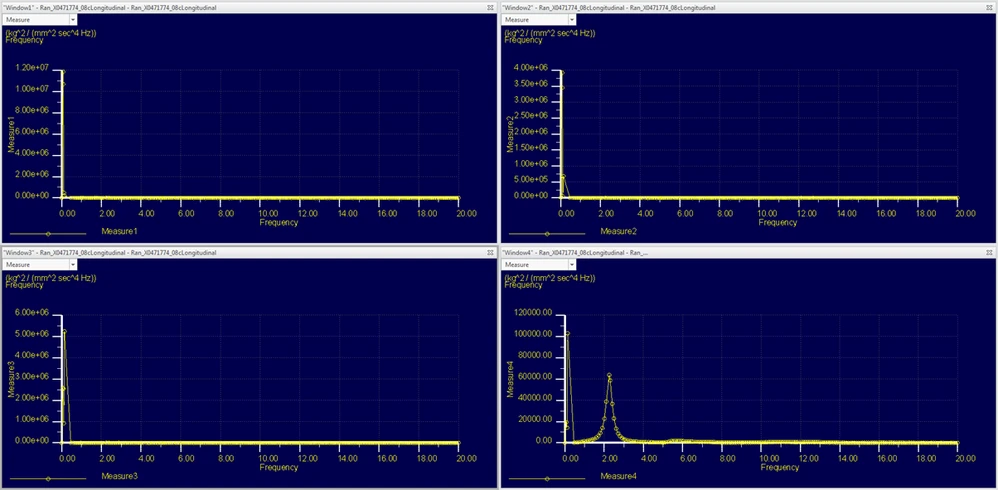
Thank you for your help or for enhancement if possible,