Jan 8, 2014 12:49 PM UTC
Question

Re: Problems with Singularities; New to Simulate

The below snippet has a max prin of 1470 psi with convergence on the solution. I think you said it was approximately 1500 psi?
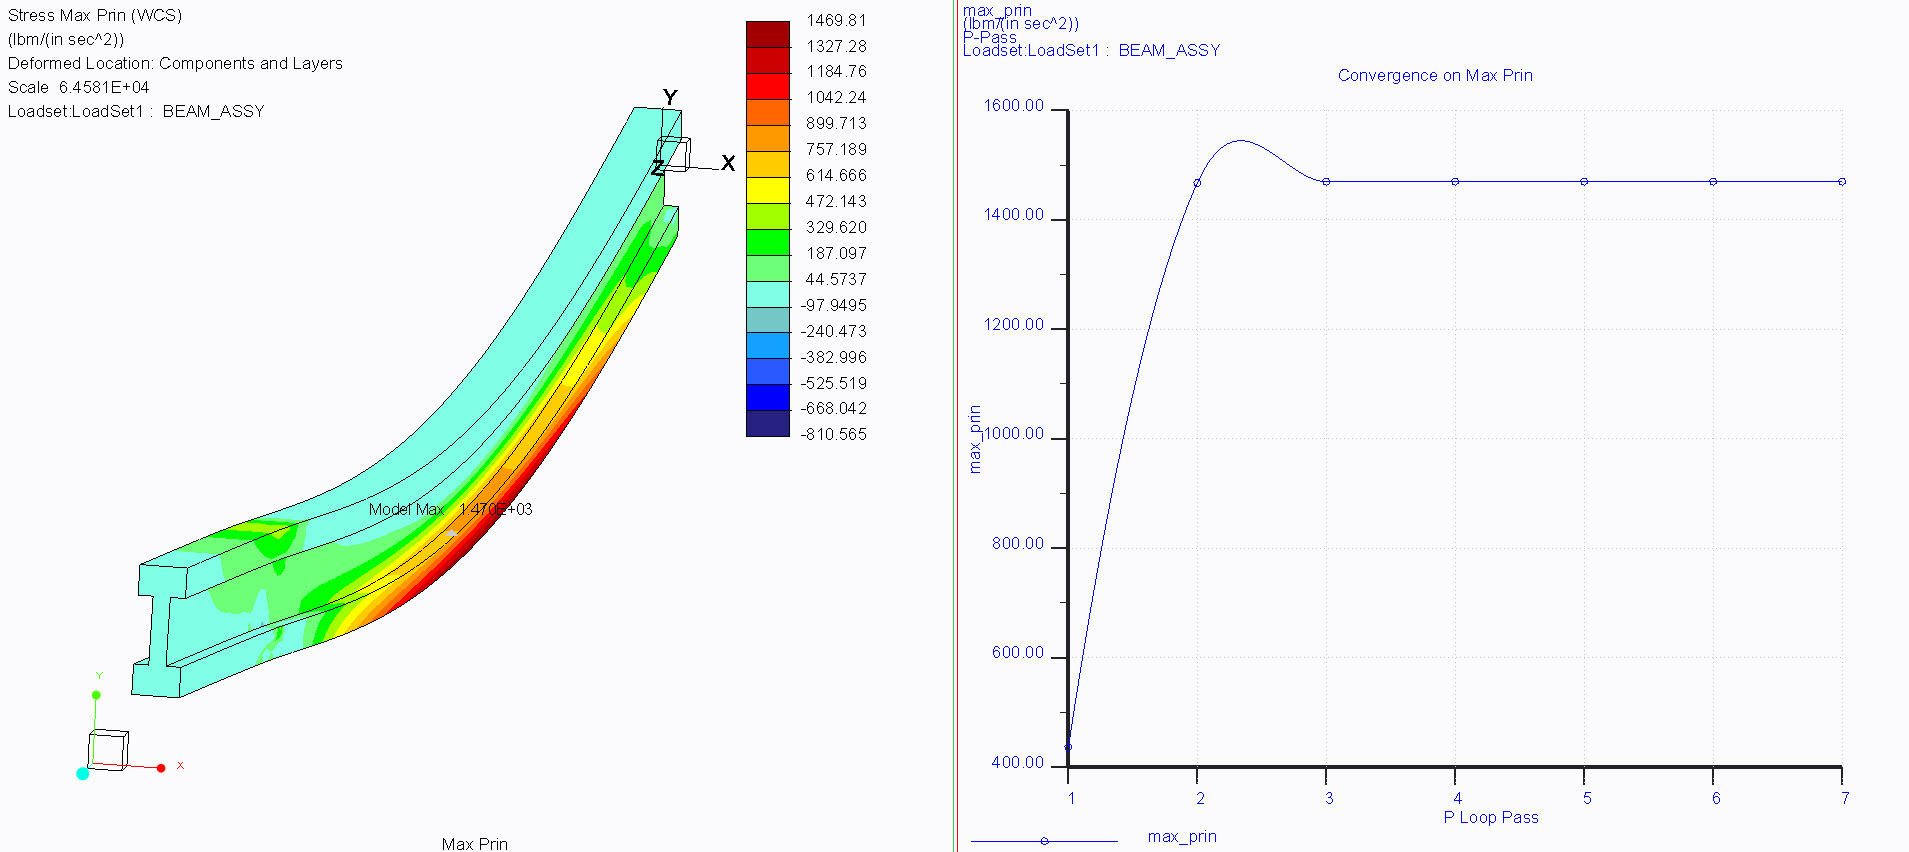

beam_max_prin.jpg

    2 replies

    Jan 8, 2014 1:25 PM UTC

    OK...now you have my curiosity peaked. This is exactly what I'm trying to get it to display.

    What did you do to get Simulate to ignore the artifically high stress concentrations located at the support on the left side in the fringe plot? Were you only displaying results for the volume region of interest and ignoring the volume region at the support?

    I was just able to get Simulate to display the results like you show, but I had to do the following:

    1) In the 'Result Window Definition' dialog box, click the display location tab

    2) Change the drop down to 'Volumes'

    3) Select a surface that is in the main volume region of interest

    4) Click the 'OK and Show' button and then select Info>Model Max

    Is that what you did?

    Jan 8, 2014 5:05 PM UTC

    Steven,

    OK...well I think I finally may have figured out my issues. I think I may have uncovered a few 'bugs' in the plotting capabilities of Simulate that were causing my results to display funny.

    If I run this analysis as a SPA and display a fringe plot of the von mises stress, the beam appears as virtually one solid color except at the area of the fixed constraint. This area is a different color due to the artificially high values Simulate has calculated in this area. If I choose the Info>Model Max option, it will display a stress value of ~13000 psi and attach it near the end of the beam. If I choose Info>View Max, it does basically the same thing. However, if I choose Info>Measures and then highlight 'max_stress_vm' and click 'Create Annotation' an annotation of the correct von mises stress (~1500 psi) will appear in the proper location on the fringe plot. This is a little bit of a pain...but nothing that I can't deal with.

    I don't really understand why the Info>Model Max option doesn't behave like the annotation. In any event, once I am able to display the correct stress with the annotation, I can then go and manually adjust the legend to correct the stress values and colors.

    Below is a file that shows the final result. Thanks for your help with this problem. Much appreciated.

    Untitled.png