Question
Re: Non-symmetric results for symmetric model and load?
Using the Mats model, the graph is basically flat, as shown below. We're only talking about 0.008 mm or 0.0003 in difference. You can't really see 0.0003 inch with the naked eye.
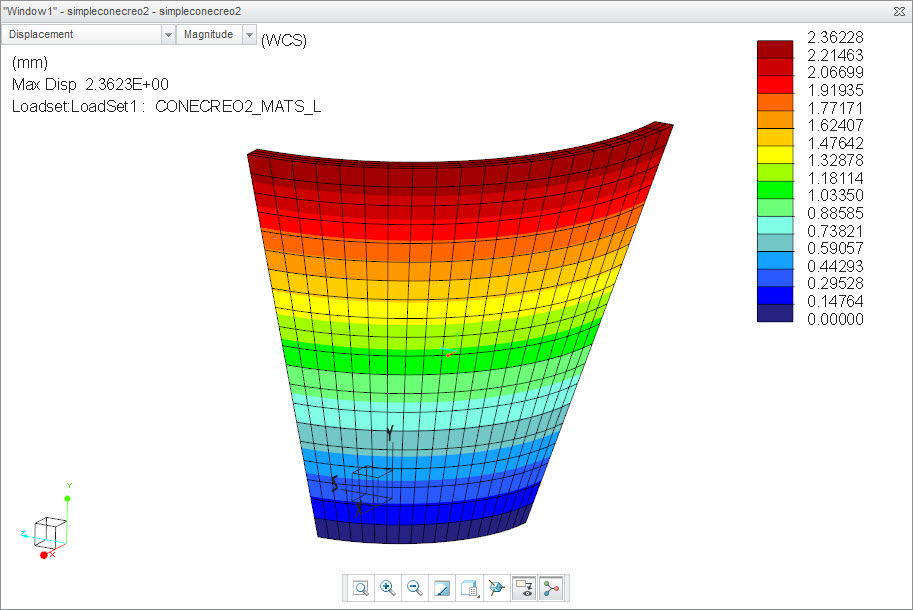
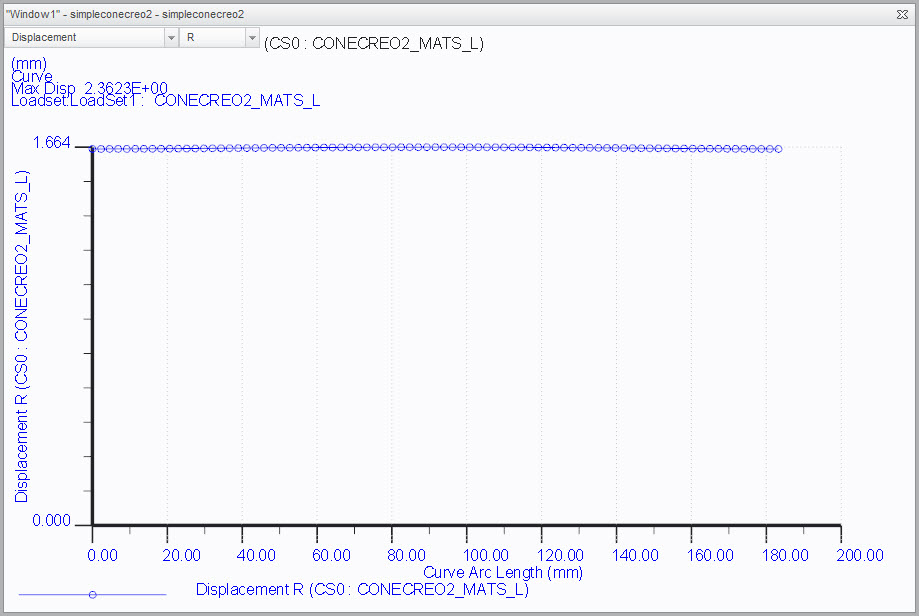

Using the Mats model, the graph is basically flat, as shown below. We're only talking about 0.008 mm or 0.0003 in difference. You can't really see 0.0003 inch with the naked eye.
Enter your E-mail address. We'll send you an e-mail with instructions to reset your password.